How the Digital Money Adoption Score Works
The Digital Money Adoption (DMA) score tracks client adoption, as opposed to infrastructure build. It gives bank and payment product managers a way to track what peers are deploying and to guide their own product planning and sales research. The current scores are on Measurement & Analysis.
What the Score Measures
The Stablecoin Field Guide methodology breaks the five Market Demand Vectors into 15 use cases. Each use case is scored across six Market Adoption Dimensions. The resulting score places each use case in a stage of the Technology Adoption Life Cycle described in Geoffrey A. Moore’s classic book, Crossing the Chasm: Marketing and Selling Disruptive Products to Mainstream Customers.
Each use case is scored from 1 to 10 on each of the six Market Adoption Dimensions:
| Dimension | What it measures |
|---|---|
| Market Evidence (ME) | Observable volume and adoption |
| Institutional Engagement (IE) | Named institutions and funded commitments |
| Regulatory Clarity (RC) | A usable legal path |
| Infrastructure Readiness (IR) | Rails, custody and interoperability |
| Revenue / Business Case (RBC) | Documented economic value |
| Customer Demand (CD) | Buyer pull, paid use and independent third-party research |
The composite score is the equal-weight average of the six dimension scores, rounded to the nearest 0.5. When the average falls exactly halfway between two half-points, such as 5.25 or 5.75, it rounds to the whole number (5.0 or 6.0). It reflects the weight of documented evidence. A high score means institutions have built and are using the capability; it does not mean a large share of the market has adopted it.
Moore Technology Adoption Life Cycle
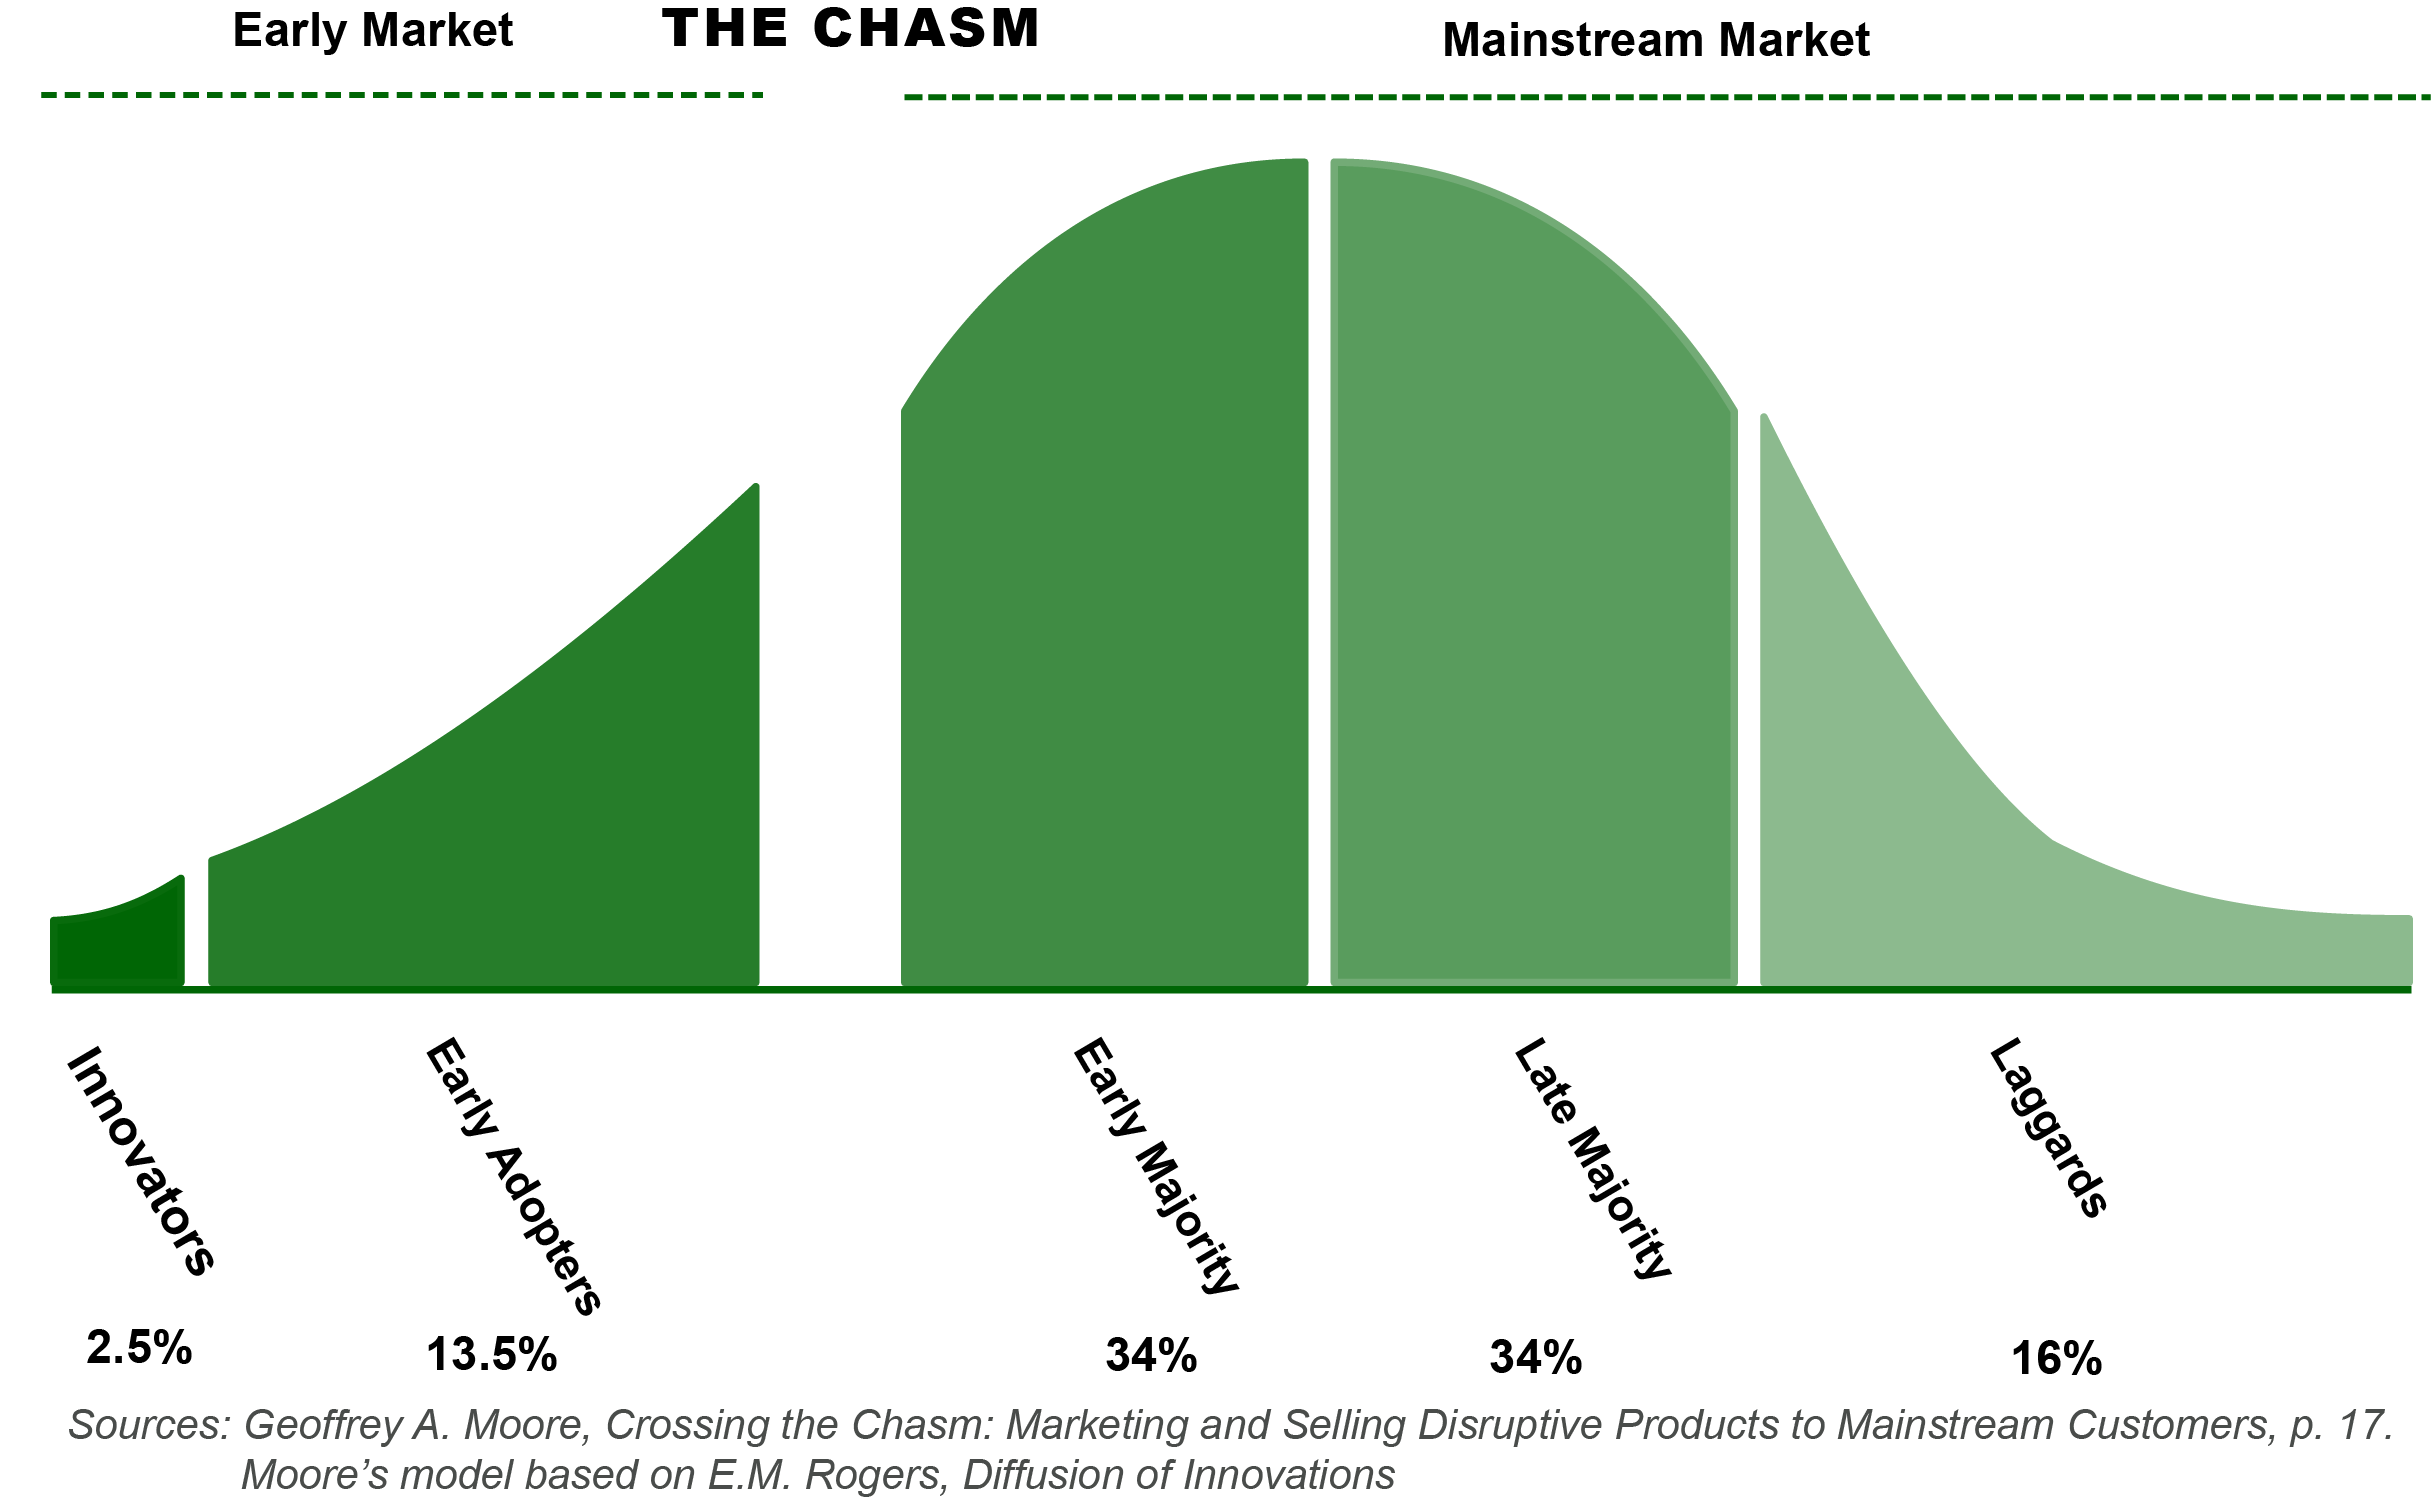
The composite score maps to one stage of Moore’s life cycle. Each stage is also an Adoption Cohort, so a use case has one label, not two.
| Score | Cohort | Stage | What the evidence shows |
|---|---|---|---|
| 1.0–4.0 | 4 | Innovator | Guidance, pilots and developer or crypto-native activity; few regulated institutions in production |
| 4.5–5.0 | 3 | Early Adopter | A few institutions live, often on their own networks; volume small or undisclosed; interoperability or legal path incomplete |
| 5.5–6.5 | 2 | Late Early Adopter | Production at named firms with measurable but concentrated volume; mainstream institutions still piloting |
| 7.0–7.5 | 1 | Approaching Chasm | Production at multiple regulated institutions, repeat client use and a usable legal path; still a small share of the market |
| 8.0–8.5 | — | Chasm: crossing in progress | Pragmatist buyers adopting on peer references, not pilots |
| 9.0–10.0 | — | Early Majority and beyond | Standard practice among mainstream institutions |
What the stages do not mean
A stage measures supply-side institutional readiness, not market penetration. Penetration is still small even where readiness is highest:
- Stablecoins carried 0.19% of B2B cross-border payment value in 2025 (Allium).
- Of more than $32 trillion in U.S. Treasuries, less than 0.05% are held in tokenized form (Duffie, Jackson Hole 2026).
- About 5% of the more than $6 trillion in daily Treasury repo is tokenized, but virtually all of it is between affiliates of the same firm (same source).
DMA Score Components
Select any box in the chart to see its definition.
Click any box to see its definition and document reference.
Digital Money Adoption Score
An evidence-based editorial score that rates 15 stablecoin use cases across 6 Market Adoption Dimensions on a 1–10 scale. The composite score is the equal-weight arithmetic mean of all six dimension scores, rounded to the nearest 0.5. It reflects the weight of documented evidence as of a given date — not a market forecast or investment rating.
Related Pages
- Measurement & Analysis — the five demand vectors and current scores.
- Multi-Report Synthesis and Research Sources — the reports behind the scores.
Page History
14 reader-facing changes since 2026-07-11; last change 2026-10-15 (v1.1).
Show all changes
| Date | Release | Change |
|---|---|---|
| 2026-10-15 | v1.1 | How the Adoption Score Works states the rounding rule for halfway averages |
| 2026-10-14 | v1.0.1 | remove remaining v0.9 score references (Moore and CD pop-ups, buyer personas, overview, roadmap) |
| 2026-10-13 | v1.0.1 | retire v0.9 DMA scores from the site; archive v0.9 page in research/archive; redirect old URL |
| 2026-10-13 | v1.0 | one adoption scale; Moore stages aligned to cohort bands (Approaching Chasm from 7.0, Early Adopter 4.5-5.0, Innovator up to 4.0); penetration evidence added; v0.9 score chart replaced with table |
| 2026-10-13 | v1.0 | move Moore adoption life cycle and DMA concept map to new Methodology page; plain-language score summary on Measurement & Analysis |
| 2026-10-12 | v1.0 | Glossary page consolidating the Solution Viability glossary (43 terms; Term, Definition, Type) |
| 2026-09-14 | v0.9 | Release change to v0.9. Added DMA score, combined Use Cases with Adoption, rewrote the score overview page, updated roadmap, and posted the 09-14 News Digest. note to home plus roadmap changes |
| 2026-09-08 | v0.9 | Fixed Use Cases Overview typo |
| 2026-09-08 | v0.9 | Updated Use Cases Overview with DMA score and added images to News Digest |
| 2026-07-12 | v0.8 refresh | Edits to Use Cases Overview |
| 2026-07-12 | v0.8 refresh | Edits to Use Cases Overview and ACH graphic |
| 2026-07-12 | v0.8 refresh | Added Use Case Overview and a Roadmap section. Updates Use Case and Adoption articles. |
| 2026-07-12 | v0.8 refresh | Added Use Case Overview, Updated Use Case pages, and a Roadmap section. |
| 2026-07-11 | v0.8 refresh | Added Use Case Overview and updated existing pages |
Infrastructure and formatting commits are omitted. Release-level detail is in the Release Notes.